


During pipeline construction, it is a requirement for all work to be planned and executed in-line with recognised industry Quality Assurance (QA) standards. An independent inspector will also review the completed work at key stages and confirm it meets relevant acceptance criteria – Quality Control (QC). Running an ILI tool is no different.
Most Pipeline Operators rely heavily on In-line Inspection (ILI) data to support their integrity management decision-making, and therefore understanding whether the ILI tool has performed in line with its published performance specification is critical. ILI performance is also a key contractual consideration – “have I got what I paid for?”
To address this, API 1163 [2021] provides 2 quality management frameworks:
- Firstly to verify that an ILI system has been selected, prepared and run in a manner that is capable of achieving the stated vendor performance specification.
- Secondly to validate as-run performance against the performance specification.
Our previous articles in this series capture the verification aspects of API 1163 as part of wider integrity management considerations when running crack detection technology. This article will focus on the complex area which is ILI validation.
ILI Reporting Process
Numerous reports are issued throughout the duration of an ILI crack-detection campaign. Once the evaluation of the data has commenced, ILI vendors typically provide a sample of ‘interesting’ or ‘critical’ anomalies and recommend field verification is completed. The intention of this is that findings can be integrated back into the data-analysis to refine the output of the final report (at least this is how it is meant to work). Although less so for standard metal loss inspection, this step is considered critical in a crack detection campaign where some ‘calibration’ is generally required to reduce uncertainty, particularly surrounding the classification of ‘crack-like’ features.
Operators typically only consider entering into a formal tool “validation” stage following the delivery of the final inspection data. It is important to note that these validations may not always target reported ILI features. Other threat-susceptible locations may be targeted to check if any ‘significant’ features (those with dimensions which meet the tool reporting specification) may have been missed which feed into the probability of detection (POD) assessment.
ILI tool validation using API 1163 involves an as-run appraisal of several standard industry performance metrics as published by the vendor in the tool performance specification, including:

Within API 1163, we often see the words POD and POI, but what exactly are they?
Probability of detection (POD)
This is the likelihood that an anomaly is actually detected by the ILI tool.
In order to calculate the POD, we need to define some key terms:
True Positives (within specification) – An anomaly that has been reported by the ILI and which has dimensions greater than or equal to the normal detection thresholds
False Negatives (within specification) – An anomaly that has not been reported by the ILI but that was found in the field with dimensions greater than or equal to the stated ILI detection thresholds (or the reporting specification agreed upon by the operator and the service provider)
In addition to those above, there are some more definitions which are not used directly for calculating POD but are useful to document:
True Positive (below spec) – An anomaly that has been reported by the ILI and which has one or more dimension below the stated ILI detection thresholds.
False Positive (within spec) – an anomaly that has been reported by the ILI as above the stated ILI detection thresholds but that was not found by the NDE used to identify anomalies.
False Positive (below spec) – An anomaly that has been reported by the ILI as below the stated detection thresholds but that was not found by the NDE used to identify anomalies in the anomaly set.
False Negative (below spec) – An anomaly that has not been reported by the ILI but that was found by the NDE used to identify anomalies and that has one or more dimensions less than the normal detection thresholds.
The equation to calculate POD is:

A typical POD, as stated in an ILI vendor’s performance specification, is 90%; meaning that 9 times out of 10 the tool will detect an anomaly which sits within the performance specification constraints. For crack detection ILI these constraints can be complex and some examples are given below:
- Exceeds minimum length and depth dimensional thresholds (inclusive) – for larger features POD will theoretically be higher although vendor information is not readily published.
- Feature located within minimum and maximum wall thickness range.
- Angle to major pipe axis within specified limits.
- Through-thickness angle within specified limits.
- Tool velocity within acceptable limits at feature location.
- Feature is not associated with geometric deformations, dents.
- Feature is not associated with sensor-lift off due to debris.
It should be noted that this is also telling us that at 90%, 1 in 10 features within the specification constraints may go undetected. An important point to consider here: if you have an anomaly morphology that is outside of the specification constraints, such as cracking associated with geometric deformation or cracking that angled too far away from the through wall direction, POD may be impacted significantly. This further re-enforces the importance of understanding the integrity threat well before the ILI campaign, not just after the tool has been run.
Probability of Indication (POI)
This is the likelihood that a detected anomaly is identified or “classified” correctly by the ILI vendor as calculated below:

‘Number of correct identifications’ is the number of times an ILI vendor has classified the anomaly (e.g. crack-like indication), and it is confirmed during investigations.
‘Number of incorrect identifications’ is of course the opposite, where an ILI vendor has classified the anomaly (e.g. crack-like indication), and something different (e.g. corrosion) is confirmed during investigations.
Similarly to POD, a typical POI as stated in an ILI vendor’s performance specification is 90%, meaning that they are stating that 9 times out of 10, they will correctly classify (identify) an anomaly. Similar specification constraints exist as with POD.
If POD and/or POI are below that stated in the performance specification, the reasons behind this can be investigated. In some cases, the features or their location may be outside of the standard specification constraints as discussed above and it is therefore important to suitably appraise each feature before drawing any conclusions on tool performance.
Probability of sizing (POS)
Probability of sizing is slightly different to POI and POD in that it only evaluates the “True Positives (within spec)” for their sizing accuracy. Again, the same specification constraints will generally apply to sizing as with POI and POD.
A typical method to visualise the ILI sizing performance uses unity plots which compare ILI sizing to field-measured sizing. An example of a unity plot is shown below with three ‘crack-like’ features plotted. The ordinates represent the as-reported depth dimensions from the ILI and associated field measurements. The superimposed ellipses represent the envelope of ILI and field measurement tolerances. Any feature with an ellipse touching the blue dashed unity line should be considered to be within sizing specification.
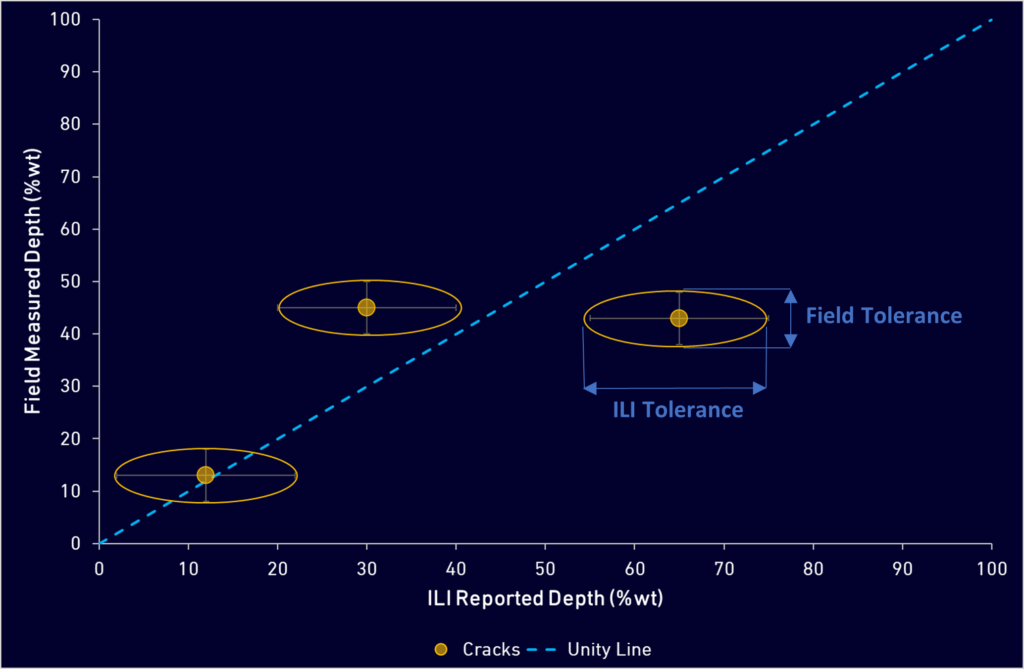
Separate unity plots can also be constructed to examine tool sizing performance with different feature sub-populations associated with key threat drivers e.g. seam weld versus pipe body calls, or calls in field bends versus straight pipe etc. As with any statistical analysis, having a sufficiently large sample population is critical to the reliability of results.
Before moving on, it is important to note that field measurement tolerances are often overlooked when appraising ILI tool performance, however they can actually present a significant source of uncertainty. The competence of the NDE technician measuring the type of feature, the process they are following and the equipment they are using all contribute to this. Validation of the field measurements is therefore just as important as validation of the ILI technology. Frontline’s experts can also support with the process of selecting and validating NDE technologies to support ILI validation purposes.
Levels of Validation
API 1163 (2021) describes three levels of assessment, Level 1, 2 & 3. Depending on the situation, a combination of all assessment levels may be appropriate.
Various factors affect which level(s) of assessment should be carried out – these are primarily driven by the level of risk associated with the integrity threat and the existing validation knowledge available for the ILI tool in the same pipeline conditions.
The conclusions that can be drawn regarding tool performance become more accurate with higher validation levels, although the level of data required – primarily in the form of field verification results – and therefore the time, cost and effort – increase significantly.

Seem like a lot of work? We never said it was easy!
The next question is how to factor the validation findings into your integrity management response.

If performance issues are present, additional investigation will be required to define the reasons behind this. Some of these issues may be resolvable in either the current or future campaigns through the incorporation of additional available information into the data evaluation process:
- Low POI – pipeline threat knowledge not integrated into the analysis to support classification
- Out-of-specification sizing – field data not integrated into the analysis to support selection of optimum sizing model.
Frontline Integrity have an extensive track record of providing independent support to Pipeline Operators to diagnose and manage ILI tool performance issues within their integrity management response.
Ultimately, if confidence in the ILI tool performance cannot be achieved at specific locations, or across the entire pipeline, other risk-management measures should be considered. Potential options are:
- A hydrotest – Catch any critical anomalies that may have gone undetected.
- A pull test – Validation of the tool performance in a representative full-scale, controlled environment - ideally cut out pipe sections containing the actual target anomalies.
- Additional targeted verifications ideally suited to susceptible locations where tool performance may be sub-optimal.
- Implementation of technology improvements.
- Additional inspections with a different vendor.
- Making changes to operation (dependent on the threat level).
API 1163 development
The world has changed a lot since 2013, and so has API 1163. An update to the 2013 edition of API 1163 was issued in 2021 with many of the changes focused on providing the Pipeline Operator with more ability to interrogate ILI results:
- More specific definitions of the required criteria to achieve validation at each level are included, as well as guidance relating to a “Comparison with Records” - the precursor to Level 1 validation.
- Construction of unity plots comparing ILI results to those from a previous inspection is suggested as a method for achieving Level 1 Validation. From this, it is straightforward to calculate the percentage of anomalies that lie within the ILI tolerance and compare this with the stated certainty for the tolerance level used, to assess whether Level 1 validation has been met.
- Specific calculation methods for the estimation of POD / POI as part of Level 2 are now included, these can then be compared with the quoted values of POD / POI to help determine whether Level 2 Validation has been achieved. This also includes a table assisting classification of matches between inspections.
- Guidance has been included with regards to completing a successful assessment with an incomplete dataset, with mitigating steps suggested.
- A discussion is included relating to root cause analysis (RCA) for failed runs. This instruction intends to guide the user in a structured effort to identify the cause of a failed inspection.
- Within the discussion of evaluating probability of sizing for Level 2 Validation, guidance has been added related to the treatment of outliers, i.e., anomalies found to have significantly different dimensions in the field to that reported by the ILI.
- Guidance has been added covering the comparison of historical pipeline attributes and components, to make sure that the operators records remain up to date.
If you would like to discuss this topic further, please don’t hesitate to contact Frontline Integrity who are an independent consultancy and have extensive experience in this area.
How can we help Operators and what value do the Frontline Integrity team add?
Services Offered
Added Value
Support in identifying optimum locations to perform field verifications based on ILI results and threat susceptibility factors to provide the best appraisal of ILI performance against the target integrity threat.
Development of ILI technical specifications to ensure verification and validation of tool performance is built into the ILI campaign.
Ensuring that ILI validation is focused on tool performance with respect to the target integrity threat.
Performing level 1, 2 or 3 API 1163 validation assessments.
Independent review of ILI performance to ensure ILI costs are fully justified with maximum value extracted from ILI results
Field verification performance reviews. What level of uncertainty exists? Where can we improve?
Confirmation that appropriate people, technologies and processes are being deployed for field verification of the target integrity threats.
Support in identifying and/or reviewing any vendor root cause analysis reports into ILI tool performance.
Independent assessment of the credibility of findings and their overall impact on the use of ILI for integrity management decision-making.
Development of ‘alternative’ integrity management strategies where ILI is not available, or tool performance may be compromised.
Year-by-year Integrity management plan to ensure safe ongoing operations where other measures are required to support integrity management.
ILI vendor and tool service/technology appraisal including identification of suitable inspection tools for future inspection campaigns.
Ensuring ILI technologies are appropriately matched to the target integrity threats.
Get in touch today 😊


